System Administrator
My goal is to provide the cheapest, high availability, high performance system, easy to maintain, scalable system.
- Cheap: the architecture has to be the simplest possible.
- High availability: everything has to load balanced.
- High performance: NO virtual machines, I want high performance for any services.
- Easy to maintain: I have a config with all servers information, the architecture, nagios checks, puppet config, … are generated automatically. If a server need to be replaced, I just mark the server hidden, the architecture is updated the next minute
- Scalable: When I need new servers, I just add them to my config. The web hosting company send me the ip and the root login. I run one command and the server is deployed, the architecture is updated.
Here are the tools I’m using to administrate my servers.
PROJECT:
Price comparison engine in 9 countries, download and match of XML products.
Name of the project:
Izideal
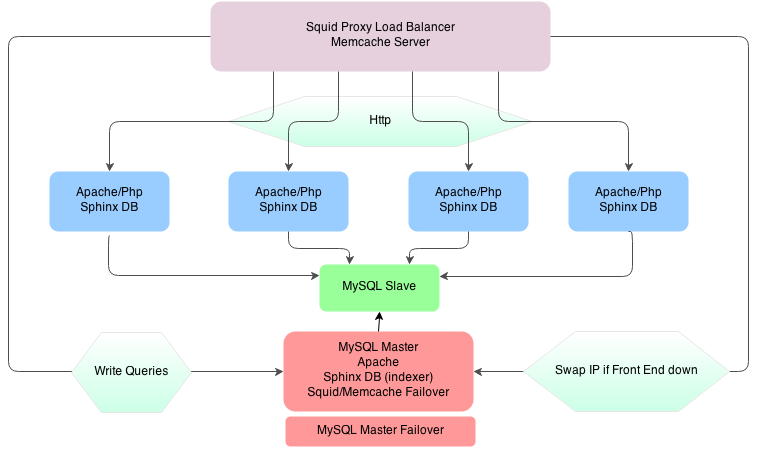
ARCHITECTURE:

I choosed to have some standalone satellites to avoid any network latency. But recently I changed them for SSD disk, I had to deport all MySQL queries on one slave server with no SSD. The size of the database is to high to fit on SSD disks.
XML Datas:
- Site: 16G
- Files: 3687
- Different XML formats: 310
MYSQL Stats:
- Size:
125G /var/lib/mysql/
- Status:
Uptime: 1722413 Threads: 22 Questions: 977147988 Slow queries: 18 Opens: 1620005 Flush tables: 1 Open tables: 401 Queries per second avg: 567.313
- Biggest tables:
+----------------+-----------+
| table          | count     |
+----------------+-----------+
| source_import  |   6843764 |
| source         |   3890563 |
| source_stat    |   4001681 |
| product        |  22877450 |
| product_lang   |  30758901 |
| product_amount | 141672826 |
+----------------+-----------+
TRAFFIC (01/01/2014 – 01/04/2014):
9 websites:
| Statistics for |
Unique visitors |
Number of visits |
Pages |
Hits |
Bandwidth |
| Total |
205 399 |
380 176 |
15 681 543 |
24 555 316 |
184.05 GB |
MONITORING (01/01/2014 – 01/04/2014):
Host State Breakdowns From Nagios:


